Infographics are visual representations of information, data, or knowledge designed to present complex information
quickly and clearly. They combine graphics, charts, and text to simplify and convey a message in an engaging and
easy-to-understand format. If you want to be equitable, you should convey all the information in an accessible way.
Infographics using bitmap image
If I am using infographics using a bitmap, should all information be in the alt ? We prefer to minimize
the use of extensive
alt text whenever possible, opting instead to provide detailed descriptions within the main text. This approach is
often easier for screen reader users who find navigating live text simpler than alt text. As suggested in the
Infographic
Alt Text
article, one can use a short summary for alt text and place a more detailed description within the main text
underneath.
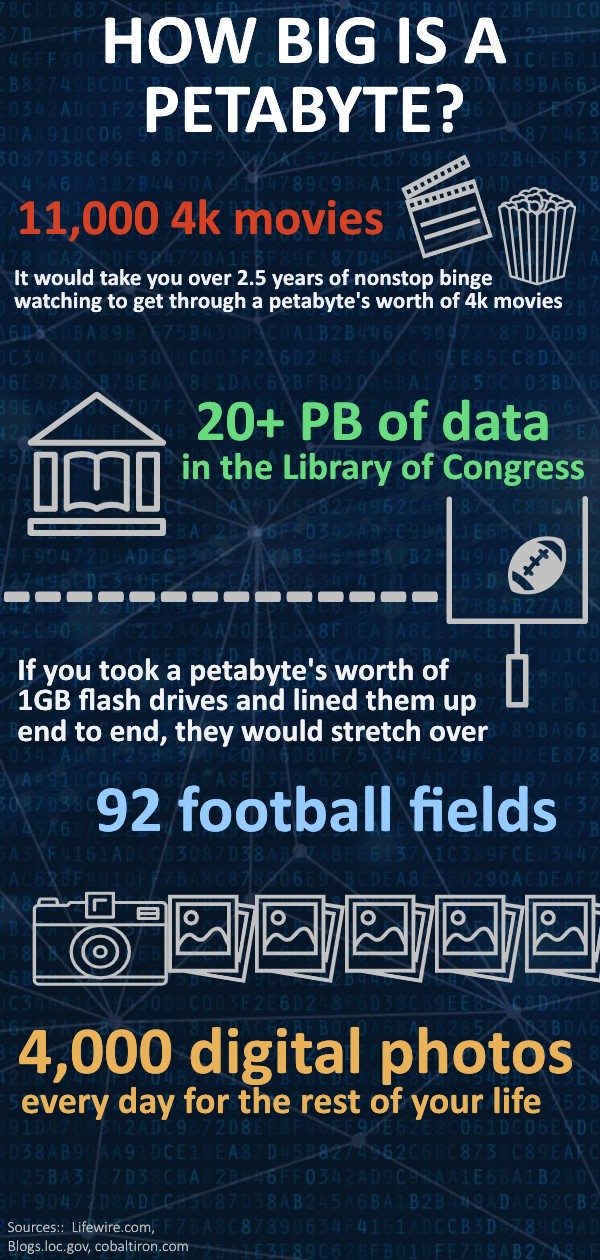
It would take you over 2.5 years of nonstop binge watching or 11, 000 movies to get through a petabyte's worth
of 4k movies.
There is 20+ PB of data in the library of congress.
If you take a petabyte's worth of 1GB flash drives and lined them up end to end, they would stretch over 92
football fields.
You can have 4,000 digital photos everyday for the rest of your life.
Sources of this image are Lifewire.com, Blogs.loc.gov and cobaltiron.com.
Code Walkthrough of the Above Example
Below is the HTML of the above example. Use the dropdown to highlight each of the individual steps that make the example accessible.
☜ Scroll to read full source ☞
Infographics using Scalable Vector Graphics(SVG)
If an SVG (Scalable Vector Graphics) is used for infographics, and the text within it would accurately describe the information inside the infographics, then SVG authors should ensure the text nodes are read
from top to bottom, left to right. As mentioned in
Tips for Creating Accessible SVG by Léonie Watson, the best way to make SVG accessible to Assistive Technologies (AT) like screen readers and speech
recognition tools is to put it directly into your HTML using the svg tag, instead of embedding it using the img tag.
Since this solution requires adding to code structure of the SVG image (specifically, the `aria-hidden` to decorative parts of the SVG and possibly changing the order of text nodes changes so screen readers from top to bottom, left to right. As such, designers should not assume that just creating an SVG with live text will "just work". A developer (or a designer with coding experience) must be involved to make sure the SVG complies with the coding steps in the walkthrough below.
Here is an example of an embedded SVG with accessible text:
Below is the HTML of the above example. Use the dropdown to highlight each of the individual steps that make the example accessible.
☜ Scroll to read full source ☞
Screen Reader Inconsistency
When using a SVG for infographics, there may be scenarios where VoiceOver (VO) in Safari reads non-clickable text
elements as links. To resolve this issue, follow these steps:
VoiceOver (VO) in Safari may announce your text element as a link due to the presence of a
tspan element within it, which it might interpret as an interactive link. To address this, use
only text elements and position them using the 'x' and 'y' attributes.
Additionally, when an id attribute is present on a text element, it can sometimes be
misinterpreted as indicating interactive or clickable content.
Testing Consideration
Please ensure that the SVG doesn't have attributes such as 'inkscape' and 'sodipodi' within it for the unit tests to pass.